Features Engineering > Dimensionality Reduction > T-SNE and UMAP
Published on 2024-02-23
Data ScienceWhile their transformed data may not be used for further data analysis, T-SNE and UMAP (non-linear) dimensionality reduction techniques provide great values for data visualization!
T-distributed Stochastic Neighbor Embedding (T-SNE) is another dimensionality reduction technique but non-linear. It is mainly used in visualization (2d or 3d) to detect patterns in the data such as outliers (anomaly detection), identifying clusters and hidden patterns which may not be apparent in high-dimensional space.
It works by modelling the similarity between pairs of data points in the high-dimensional space, and then approximating the new pairs with the same or similar similarity in a lower-dimensional representation.
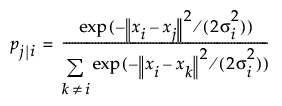
Therefore, T-SNE first computes the probability distribution to represents similarities between neighbors of the original dataset (known as pairwise conditional probability for each data point). After getting the data similarity in the original dataset/ space, the next step is to find the data similarity in the reduced space. This finding a new set of data is an optimization problem which is why T-SNE is computationally expensive.
Data Similarity in the original space:
 x: data in original space. We know x. We compute p. sigma is perplexity.
Data Similarity in the reduced space:
 y: data in reduced space. We don't know y. We know q.
Finding y (optimization problem requires multiple iterations until a threshold is reached or algorithm has converged):
by minimizing a single Kullback-Leibler divergence between the joint probability distribution P and the joint probability distribution Q

It is of importance to note that the iterative nature of t-SNE means it is not designed to produce a transformation that can be applied to new, unseen data in the same way as PCA, for example from training dataset to testing dataset. Each run of t-SNE is specific to the dataset provided, and the resulting embedding is unique to that dataset. Attempting to apply the transformation learnt from one dataset to another dataset would not yield meaningful results because t-SNE does not learn a transformation matrix in the same manner as PCA.
Going back to computation of T-SNE, Similar to k-means, we can control the number of neighbors to consider. This parameter is called perplexity and often available for fine-tuning as a 'sigma' parameter. A higher perplexity value will obviously have more smoothening effect whereas a lower perplexity value will have more emphasis on local topology.
from sklearn.manifold import TSNE
import matplotlib.pyplot as plt

X_embedded = TSNE(n_components=2, learning_rate='auto',init='random', perplexity=3).fit_transform(standardized_data) # perplexity=number of nearest neighbors
plt.scatter(X_embedded[:,0], X_embedded[:,1], c=labels, alpha=0.5)
plt.title('t-SNE Visualization')
plt.xlabel('tsne-dimension-1')
plt.ylabel('tsne-dimension-2')
plt.show()
Uniform Mapping and Projection (UMAP) is relatively new, and it outperforms T-SNE in terms of computation. That is because UMAP utilizes approximate nearest neighbors techniques to accelerate computation. As in the t-SNE case, UMAP tries to find a metric in both the original (large) space X, and the lower dimension output space Y, which can be (topologically) matched, but the algorithms or mathematical formula used to find the new dataset in reduced data space is different from T-SNE.
In UMAP, the two parameters "n_neighbors" and "min_dist" are utilized to control the balance between local and global structure for the new dataset.
!pip install umap-learn
import matplotlib.pyplot as plt
from umap import UMAP
umap = UMAP(n_components=2, n_neighbors=15, min_dist=0.1)
umap_embedding = umap.fit_transform(standardized_data)
plt.scatter(umap_embedding[:,0], umap_embedding[:,1], c=labels, alpha=0.5)
plt.title('UMAP Visualization')
plt.xlabel('ump dimension-1')
plt.ylabel('umap dimension-2')
plt.show()
References https://umap-learn.readthedocs.io/en/latest/how_umap_works.html https://pair-code.github.io/understanding-umap/ https://cs.stanford.edu/people/karpathy/tsnejs/csvdemo.html https://projector.tensorflow.org/